Fogey
Member
How many of us fully understand the histogram? I didn't until I was given this explanation by a zoologist/semi professional photographer.
We've all heard the expression of a 32 or 64 bit computer operating system; bits and bytes, pixels and megapixels; Yes? Well all these are based on the binary numerical system of 1,2,4,8,16 etc., each number doubling going up or halving when coming down. They equally relate to speed of the computer processor, file size and size of digital transfer.
Well the digital camera shares exactly the same principles. The aperture measurement double and halves when going up and down, as does the shutter speed and ISO - and strangely enough the histogram.
It has to be appreciated that the ISO settings on the camera and the resulting histogram of the shots taken are closely related.
So, to explain.
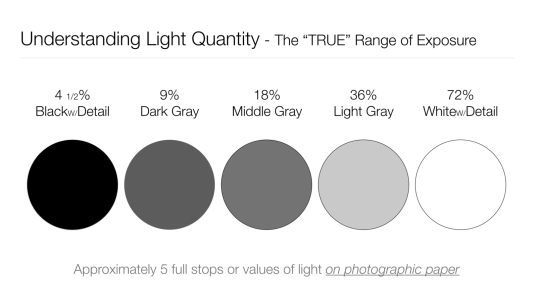
The histogram gives a pictoral graph of the black and white tones of the photograph, with the optimum, (correct exposure), being 18% grey. On the graph, the left hand side deals with under-exposure, the right, over exposure.
So, the first reading would be one shade of grey, (black), the second reading two shades of grey, the third four shades of grey, and so on, with each subsequent reading doubling until we reach white. Now, remember; the shades of grey on the histogram are derided from the actual colour palette, so it's fair to say that any given scale on the histogram, (ISO setting), will contain a certain percentage of the colour palette chosen for the photograph.
Assuming the camera's settings have been set to show the ISO in 1/3 of a stop, the sequence would be:
100, 125, 160
200, 250, 320
400, 500, 640
800, 1000, 1250
and so on.
Now don't take my word for this; try it for yourself. The 2/3 rd settings, (in green), will give the optimum colour rendition, reducing the colour banding in the skies being the most obvious; also look for a more atmospheric feel to your photography, The next most optimum will be the 1/3rd setting and the interger, the least.

